目前工作中的前端開發因規範與IE向下相容只能使用es5,要使用比較新的js語法只能透過underscore.js來實現
但最近看了許多關於es6的資料,想要來練習一下
若單純練習語法就太無聊了,所以決定使用es6的語法來DIY一個chart
首先使用class定義Chart的Object
在使用es6之前,只能透過擴展prototype達成method共用
1 | var Chart = function(){ |
現在有了class就不需要再分開寫了,看起來直覺多了
1 | class Chart{ |
首先初始化canvas,canvas可以想像成是一個畫布,我們必須設定畫布的大小和透過getContext('2d')取得渲染環境
1 | constructor(params){ |
接著將chart的資料設置到canvas上,因為對於canvas而言原點是從左上角(0,0)的座標開始,所以使用原始資料直接打出點的話,會發現會上下相反,所以需要將y軸進行反轉
因為還沒有想到chart要使用哪種顏色,就先使用亂數產生吧…1
2
3
4
5
6
7
8
9
10
11
12
13
14
15_initDataSet(){
for(const [index, point] of this._matrix.entries()){
var reverseY = this._canvasHeight - point[1];
this._dataSet.push({
index: index,
x: point[0],
y: reverseY,
color: this._randomColor()
});
}
}
_randomColor(){
return '#' + (Math.random() * 0xFFFFFF << 0).toString(16);
}
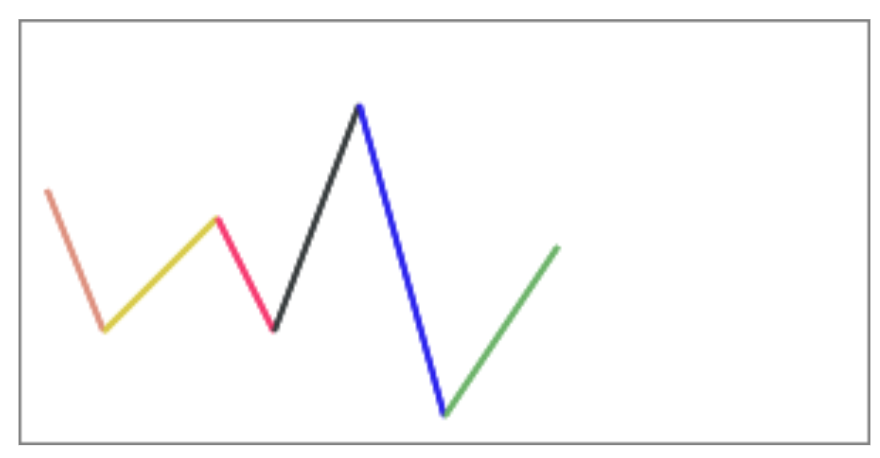
我們的chart需要有畫布的外框且資料兩點需要使用直線串連起來1
2
3
4
5
6
7
8
9
10
11
12
13
14
15
16
17
18
19
20
21
22
23
24
25
26
27
28
29
30
31
32
33
34
35constructor(params){
this._LINE_TENSION = 0.2
this._LINE_WIDTH_ORI = 2;
this._LINE_WIDTH_FOCUS = 5;
this._COLOR_GRAY = 'gray';
this._COLOR_WHITE = 'white';
}
_initFrame(){
this._drawRect({
x: 0,
y: 0,
width: this._canvasWidth,
height: this._canvasHeight,
lineWidth: this._LINE_WIDTH_ORI,
color: this._COLOR_GRAY
});
}
_initLines(){
let prePoint;
for(const [index, point] of this._dataSet.entries()){
if(index == 0){
prePoint = point;
continue;
}
this._drawLine(prePoint, point);
prePoint = point;
}
}
draw(){
this._initFrame();
this._initLines();
}
執行一下看看效果
有了簡單的雛形後,接著可以慢慢慢慢進行優化,增加新功能
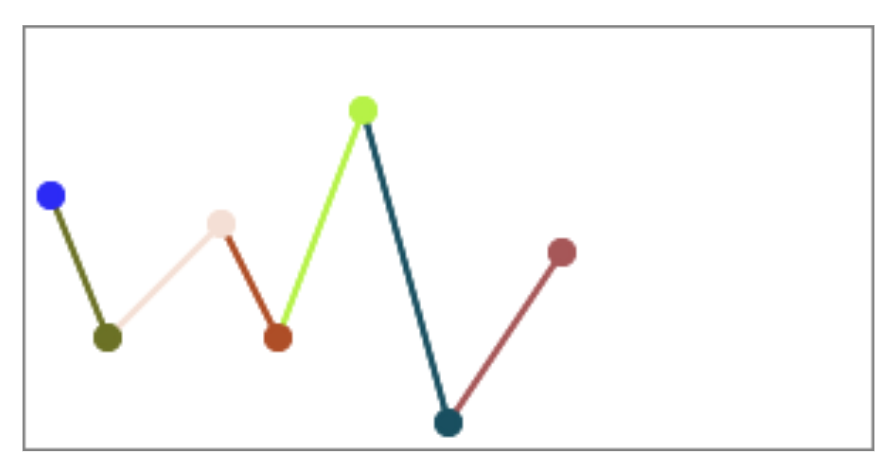
像現在我想凸顯每個資料點,將點放大,所以需要增加繪製圓形的function
1 | _drawCircle(point){ |
執行一下看看效果
市面上大部份cahrt都可以透過滑鼠去取得最近資料點,所以我們的chart也來要增加此功能
首先在canvas增加mousemove事件,用於取得目前滑鼠的座標,接著算出每個資料點與目前滑鼠之間的距離 (這次參考Flot Charts的做法)1
2
3
4
5
6
7
8
9
10
11
12
13
14
15
16
17
18
19
20
21
22
23
24
25
26
27
28
29
30
31
32
33
34
35
36
37
38
39
40
41
42
43
44_bindMouseEvent(){
const _self = this;
this._canvas.addEventListener("mousemove", (event) => {
const rect = _self._canvas.getBoundingClientRect();
const x = event.clientX - rect.left;
const y = event.clientY - rect.top;
_self._findNearPointByMouse({x: x, y: y});
});
}
_drawFocusPoint(point){
this._drawCircle({x: point.x, y: point.y, radius: this._radius, lineWidth: this._LINE_WIDTH_FOCUS, color: point.color});
}
_findNearPointByMouse(mousePos){
let minDistancePoint;
let minDistance = Number.MAX_VALUE;
for(var index=0, size= this._dataSet.length; index<size; index++){
const currentPos = this._dataSet[index];
const distanceBetweenTwoPoints = this._distance(currentPos, mousePos);
if(minDistance > distanceBetweenTwoPoints){
minDistancePoint = currentPos;
minDistance = Math.min(minDistance, distanceBetweenTwoPoints);
}
}
if(!this._preFocusPoint){
this._drawFocusPoint(minDistancePoint);
this._preFocusPoint = minDistancePoint;
return;
}
/*
if pre point isn't self, it's need to render
*/
if(this._preFocusPoint.index !== minDistancePoint.index){
this.render();
this._drawFocusPoint(minDistancePoint);
}
this._preFocusPoint = minDistancePoint;
}
_distance(point1, point2){
return Math.sqrt(Math.pow(point1.x - point2.x, 2) + Math.pow(point1.y - point2.y, 2));
}
執行一下看一下效果 (這裡為了顯示實際效果, 所以就直接執行js而不是使用貼圖,瀏覽器必須支援es6才能看見,畢竟沒有透過babel進行轉換)
Chart
以下是完整的程式碼,看起來與java有點像…
也可以到我github上去下載完整的程式碼,今天的練習就到此結束了1
2
3
4
5
6
7
8
9
10
11
12
13
14
15
16
17
18
19
20
21
22
23
24
25
26
27
28
29
30
31
32
33
34
35
36
37
38
39
40
41
42
43
44
45
46
47
48
49
50
51
52
53
54
55
56
57
58
59
60
61
62
63
64
65
66
67
68
69
70
71
72
73
74
75
76
77
78
79
80
81
82
83
84
85
86
87
88
89
90
91
92
93
94
95
96
97
98
99
100
101
102
103
104
105
106
107
108
109
110
111
112
113
114
115
116
117
118
119
120
121
122
123
124
125
126
127
128
129
130
131
132
133
134
135
136
137
138
139
140
141
142
143
144
145
146
147
148
149
150
151
152
153
154
155
156
157
158
159
160
161
162
163
164
165
166
167
168
169
170
171
172
173
174
175
176
177
178class Chart{
constructor(params){
this._LINE_TENSION = 0.2
this._LINE_WIDTH_ORI = 2;
this._LINE_WIDTH_FOCUS = 5;
this._COLOR_GRAY = 'gray';
this._COLOR_WHITE = 'white';
this._id = params.id;
this._matrix = params.matrix;
this._radius = params.radius;
this._dataSet = [];
this._curveDataSet = [];
this._canvas;
this._canvasWidth;
this._canvasHeight;
this._ctx;
this._preFocusPoint;
this._init();
}
_init(){
this._canvas = document.getElementById(this._id);
if(!this._canvas.getContext){
throw "can't get canvas context!";
}
this._canvasWidth = this._canvas.width;
this._canvasHeight = this._canvas.height;
this._ctx = this._canvas.getContext('2d');
this._initDataSet();
this._bindMouseEvent();
this.draw();
}
_initDataSet(){
for(const [index, point] of this._matrix.entries()){
var reverseY = this._canvasHeight - point[1];
this._dataSet.push({
index: index,
x: point[0],
y: reverseY,
color: this._randomColor()
});
}
}
_initFrame(){
this._drawRect({
x: 0,
y: 0,
width: this._canvasWidth,
height: this._canvasHeight,
lineWidth: this._LINE_WIDTH_ORI,
color: this._COLOR_GRAY
});
}
_initLines(){
let prePoint;
for(const [index, point] of this._dataSet.entries()){
if(index == 0){
prePoint = point;
continue;
}
this._drawLine(prePoint, point);
prePoint = point;
}
}
_initCircles(){
const _self = this;
this._dataSet.forEach((point) => {
_self._drawCircle({
x: point.x,
y: point.y,
radius: _self._radius,
lineWidth: _self._LINE_WIDTH_ORI,
color: point.color
});
});
}
_bindMouseEvent(){
const _self = this;
this._canvas.addEventListener("mousemove", (event) => {
const rect = _self._canvas.getBoundingClientRect();
const x = event.clientX - rect.left;
const y = event.clientY - rect.top;
_self._findNearPointByMouse({x: x, y: y});
});
}
_randomColor(){
return '#' + (Math.random() * 0xFFFFFF << 0).toString(16);
}
_drawRect(params){
this._ctx.lineWidth = params.lineWidth;
this._ctx.strokeStyle = params.color;
this._ctx.beginPath();
this._ctx.rect(params.x, params.y, params.width, params.height);
this._ctx.stroke();
}
_drawLine(point1, point2){
this._ctx.lineWidth = point2.lineWidth;
this._ctx.strokeStyle = point2.color;
this._ctx.beginPath();
this._ctx.moveTo(point1.x, point1.y);
this._ctx.lineTo(point2.x, point2.y);
this._ctx.stroke();
}
_drawCircle(point){
this._ctx.lineWidth = point.lineWidth;
this._ctx.beginPath();
this._ctx.arc(point.x, point.y, point.radius, 0, 2 * Math.PI);
this._ctx.strokeStyle = point.color;
this._ctx.fillStyle = point.color;
this._ctx.fill();
this._ctx.stroke();
}
_drawFocusPoint(point){
this._drawCircle({x: point.x, y: point.y, radius: this._radius, lineWidth: this._LINE_WIDTH_FOCUS, color: point.color});
}
_findNearPointByMouse(mousePos){
let minDistancePoint;
let minDistance = Number.MAX_VALUE;
for(var index=0, size= this._dataSet.length; index<size; index++){
const currentPos = this._dataSet[index];
const distanceBetweenTwoPoints = this._distance(currentPos, mousePos);
if(minDistance > distanceBetweenTwoPoints){
minDistancePoint = currentPos;
minDistance = Math.min(minDistance, distanceBetweenTwoPoints);
}
}
if(!this._preFocusPoint){
this._drawFocusPoint(minDistancePoint);
this._preFocusPoint = minDistancePoint;
return;
}
/*
if pre point isn't self, it's need to render
*/
if(this._preFocusPoint.index !== minDistancePoint.index){
this.render();
this._drawFocusPoint(minDistancePoint);
}
this._preFocusPoint = minDistancePoint;
}
_distance(point1, point2){
return Math.sqrt(Math.pow(point1.x - point2.x, 2) + Math.pow(point1.y - point2.y, 2));
}
_clear(){
this._ctx.clearRect(0, 0, this._canvasWidth, this._canvasHeight);
}
/* public */
draw(){
this._initFrame();
this._initLines();
this._initCircles();
}
render(){
this._clear();
this.draw();
console.log('render');
}
}